The QD~1 KV-load bottleneck found with eBPF, fixed with parallel loads
Note
A styled standalone version of this page (identical content, dark
theme) is served at /showcase/kvio-loadpath.html
and via htmlpreview from the repository’s docs/kvio-loadpath.html.
On a real 11.3 GB/s Gen5 NVMe, LMCache’s raw_block KV-cache loader ran at ~1.2 GB/s — about 11% of the device. The eBPF NVMe record shows why: reads were issued one 128 KiB command at a time, single-threaded, queue depth ~1. A one-file change that issues several objects’ reads at once recovers ~2.8×, and — because KV-load time is what the compute-vs-load crossover turns on — it moves that crossover toward smaller models.
rig: 8× H100, Samsung Gen5 NVMe, Linux 6.17 tracer: eBPF nvme_uring_cmd_monitor engine: LMCache raw_block io_uring_cmd fix: raw-block-parallel-load @ 1dafbb31 status: prototype-validated — more testing pending ← kvio main page
The symptom
LMCache offloads LLM KV cache to raw NVMe (the raw_block engine, io_uring_cmd passthrough on /dev/ng). Each KV object is a large blob — 8–20 MiB per rank — split into 128 KiB device commands. Loading it back should be near sequential-read speed. It wasn’t.
ioKV load, real TP4
~1.2GB/s
70B TP4, 4640 MiB per request over io_uring_cmd on /dev/ng1n1
fiodevice ceiling
11.3GB/s
same drive, 128 KiB sequential read, ioengine=io_uring
%device utilized
~11%
the loader left ~90% of the drive on the floor
The device is not the bottleneck — the software path is. The only way to know that for sure is to look at the actual NVMe commands on the wire.
The wire evidence
The eBPF tracer nvme_uring_cmd_monitor records every NVMe command on the io_uring_cmd path — opcode, LBA, byte count, the issuing thread, the io_uring user_data, and a nanosecond timestamp. Replaying a real 70B/TP4 load and reading the trace back:
serial 72,960 read commands, all from one process / one kernel thread. max concurrent in-flight objects = 1; consecutive commands belong to the same object 99.4% of the time. Each 20 MiB object’s 160 reads fire back-to-back, then the next object starts — nothing overlaps.
QD~1 within an object too The 160 commands of a single object are submitted with a ~83 µs gap between consecutive submissions, while the device completes a 128 KiB read in ~16 µs. It is submit-one, wait, submit-next — ~80% of every command is software round-trip, not device time.
the knob doesn’t help The engine is configured iouring_queue_depth=8, but raising it to 64 changes nothing — the serial single-object number stays ~1.4 GB/s. The ring’s queue depth is never used to pipeline the many non-overlapping reads of one object.
The trace also carries the LMCache trace_id in the high 32 bits of user_data, so every command is attributed back to the KV object (and TP rank) that caused it — that join is what makes this a precise measurement rather than an aggregate guess.
Why this matters — the crossover turns on it
Whether it is cheaper to reload a prefix’s KV from storage or to recompute it on the GPU is a live question in LLM serving. With TP held fixed at 4, and load time set purely by the (crippled) ~1.2 GB/s path, the balance decomposes cleanly:
model (TP4) |
GPU recompute |
NVMe load |
R = load ÷ recompute |
per-rank obj |
aggregate KV / chunk |
|---|---|---|---|---|---|
Llama-3.1-8B |
~0.38 s |
~1.82 s |
~4.8× |
8 MiB |
32 MiB |
Llama-3.1-70B |
~1.90 s |
~4.13 s |
~2.2× |
20 MiB |
80 MiB (×2.50) |
Load time ≈ aggregate_bytes ÷ 1.2 GB/s, so it grows with KV bytes (×2.27), while recompute grows with compute (×5.0). R improves ×2.2 at fixed TP4 — a real model-scale effect, isolated from TP. But that load number is a fixable software floor, not storage physics. Speed the loader up and R falls with it — the crossover moves toward smaller models.
connector-gated Prior work that finds “loading loses” is partly measuring QD~1, DRAM-bouncing loaders. A properly-pipelined loader changes the answer — which is exactly what the fix below starts to show.
Reproduce it
All three steps run on any box with an NVMe char device (/dev/ngXnY) and the LMCache raw_block engine built. No GPU or model needed — storage geometry is content-independent.
1 · Build the eBPF tracer
ebpf-syscall# in the ebpf-syscall tree; needs clang + libbpf-dev + bpftool
make LIBBPF_SYSTEM=yes nvme_uring_cmd_monitor
2 · Measure the load path under varying concurrency
kvio_parallel_probe.py# stores 128 × 20 MiB objects, then loads them back at W = 1,2,4,8,16,32
KVIO_SRC=~/LMCache python kvio_parallel_probe.py \
    --device /dev/ng1n1 --obj-mib 20 --nobj 128 \
    --workers 1,2,4,8,16,32 --qd 8
3 · Confirm the wire behavior
analyze_load_path.py# run the tracer around a load, then attribute commands to objects/ranks
sudo nvme_uring_cmd_monitor --jsonl trace.jsonl --lba-size 4096 &
# ... issue the load ...
python analyze_load_path.py trace.jsonl sem.jsonl   # prints TIDs, in-flight objects, per-cmd gap
probe result — real NVMe A trivial Python thread-pool across objects (no engine change) already lifts the load path well off its serial floor:
load concurrency |
GB/s |
vs serial |
note |
|---|---|---|---|
1 — serial (today) |
1.9 |
1.0× |
the shipped behavior |
4 workers |
2.9 |
1.5× |
|
8 workers |
5.3 |
2.8× |
best |
16 workers |
4.8–5.5 |
2.6× |
plateau ≈ 44% of device |
32 workers |
3.8 |
2.0× |
contention |
The fix
The per-object read already released the engine lock before doing I/O, and the Rust io_uring binding drops the GIL during the wait — so the objects of one batched load can simply be issued concurrently. The change factors the per-object body into _load_one_into and dispatches it over an optional pool sized by a new RawBlockCoreConfig.load_parallelism (default 1 = unchanged). The L2 adapter passes its existing num_load_workers (default 4) through, so a knob that previously only sized dispatch threads now actually parallelizes the read loop.
load_many_into — before → after# before: one object at a time, each read awaited before the next
for i, (key, entry) in enumerate(items):
    self._read_buffers([entry.offset + header], [buf], [len], [total])   # QD~1

# after: issue several objects' reads at once over the load pool
if self._load_pool and len(pending) > 1:
    futures = [self._load_pool.submit(self._load_one_into, i, key, entry, objs, results, roe)
               for (i, key, entry) in pending]
    for f in futures: f.result()
Δthe change
2 files, ~120 lines. load_parallelism config (default 1, no behavior change unless opted in); adapter wires num_load_workers → load_parallelism. LMCache branch raw-block-parallel-load, commit 1dafbb31.
✓why it’s safe
Each read touches only its own results[i]/objs[i]; the index lookup holds the lock only briefly and releases it before I/O; the binding drops the GIL in the wait. Concurrency proven on real NVMe (the 2.8× probe above).
the payoff ~2.8× on the NVMe leg flips the 70B/TP4 balance: load 4.13 s → ~1.5 s vs recompute ~1.9 s ⇒ R ≈ 0.78 — loading wins; and 8B/TP4 comes into range. The crossover is a connector problem, not a storage limit.
End to end, in a live serving stack
The numbers above are the storage leg. The open question was whether it moves user-facing TTFT once the DRAM→GPU copy, the connector, and scheduling join the path. Measured on a real vllm serve Llama-3.1-8B + LMCache MP stack, raw_block L2 on NVMe passthrough, KV resident on the device — it does.
TTFTC=1
4.0× faster
p50 3154 → 779 ms
tputC=4
5.0× higher
0.52 → 2.60 req/s
cachehit rate
47→83%
slow loads stop timing out into recompute
Default connector config (mq_timeout=10s, recompute fallback on) — what a user sees:
metric |
baseline (QD~1) |
batched |
speedup |
|---|---|---|---|
C=1 TTFT p50 |
3154 ms |
779 ms |
4.0× |
C=1 TTFT p99 |
3960 ms |
813 ms |
4.9× |
C=4 TTFT p50 |
7008 ms |
1476 ms |
4.7× |
C=4 throughput |
0.52 req/s |
2.60 req/s |
5.0× |
With recompute rescue disabled (mq_timeout=90s) the isolated storage penalty is unmasked:
metric |
baseline (QD~1) |
batched |
speedup |
|---|---|---|---|
C=1 TTFT p50 |
11885 ms |
763 ms |
15.6× |
C=4 TTFT p50 |
20248 ms |
1375 ms |
14.7× |
Batched TTFT is stable across both (779 → 763 ms) — it loads fast enough to never hit the timeout. Baseline swings 3154 → 11885 ms with the timeout, proving its slowness is the QD~1 load.
which fix This measured the batched within-object read (commit ec0a6a58) on top of the io_uring worker no-hang fix (b839153b). The cross-object load_parallelism pool of §05 (1dafbb31) is complementary and not yet measured end to end.
Why a naive serving A/B lies — four confounds
Each of these silently collapses the two arms to equal; each had to be instrumented out. Skip the guards and you “measure” no difference and wrongly conclude the fix does nothing.
L1 cache dilution
First load promotes KV to the DRAM tier; repeats hit L1, not raw_block. → N distinct prefixes, working set ≫ L1, round-robin. Guard: tier shows 0 L1.
pool starvation
eviction-policy noop + small L1 starves the staging pool → allocs fail → silent recompute. → LRU + pool sized for staging. Guard: 0 alloc failures.
recompute masking
At low mq_timeout slow loads abandon to GPU recompute, capping baseline TTFT. → sweep mq_timeout. Guard: external hit rate.
iostat blindness
Block-layer counters don’t see io_uring_cmd passthrough — they read ~0 under load. → NVMe controller Data Units Read. Guard: device GB read.
the payoff The QD~1 fix is not a microbench curiosity: 4× lower TTFT and 5× throughput on a normal 8B serving load, and the cache stays useful (83% vs 47% hit rate) instead of thrashing into recompute.
See it — the crossover on one timeline
Everything above is also a picture. The crossover measurements were captured with the full kvio tracing stack (eBPF device completions + schema-2 semantic trace + serving spans) and converted to Perfetto timelines (how-to). Below: the 8B cell — the crossover point — with the stock (QD~1) and fixed (batched) arms stacked. Same 18-prompt warm phase, same bytes, same drive; the only variable is the load path.

Request layer. Warm phases (w) are identical twins; then the measured requests diverge — fixed’s TTFTs are slim ticks (~490 ms), stock’s are the fat load_ttft bars (~2.4 s each) stretching to the end of the capture.

KV-object layer. Each request fans into ~58 object loads. Fixed’s objects are brief ticks; stock’s are long dashes — and the objects in flight counter shows stock grinding one-object-at-a-time for the whole tail of the timeline.
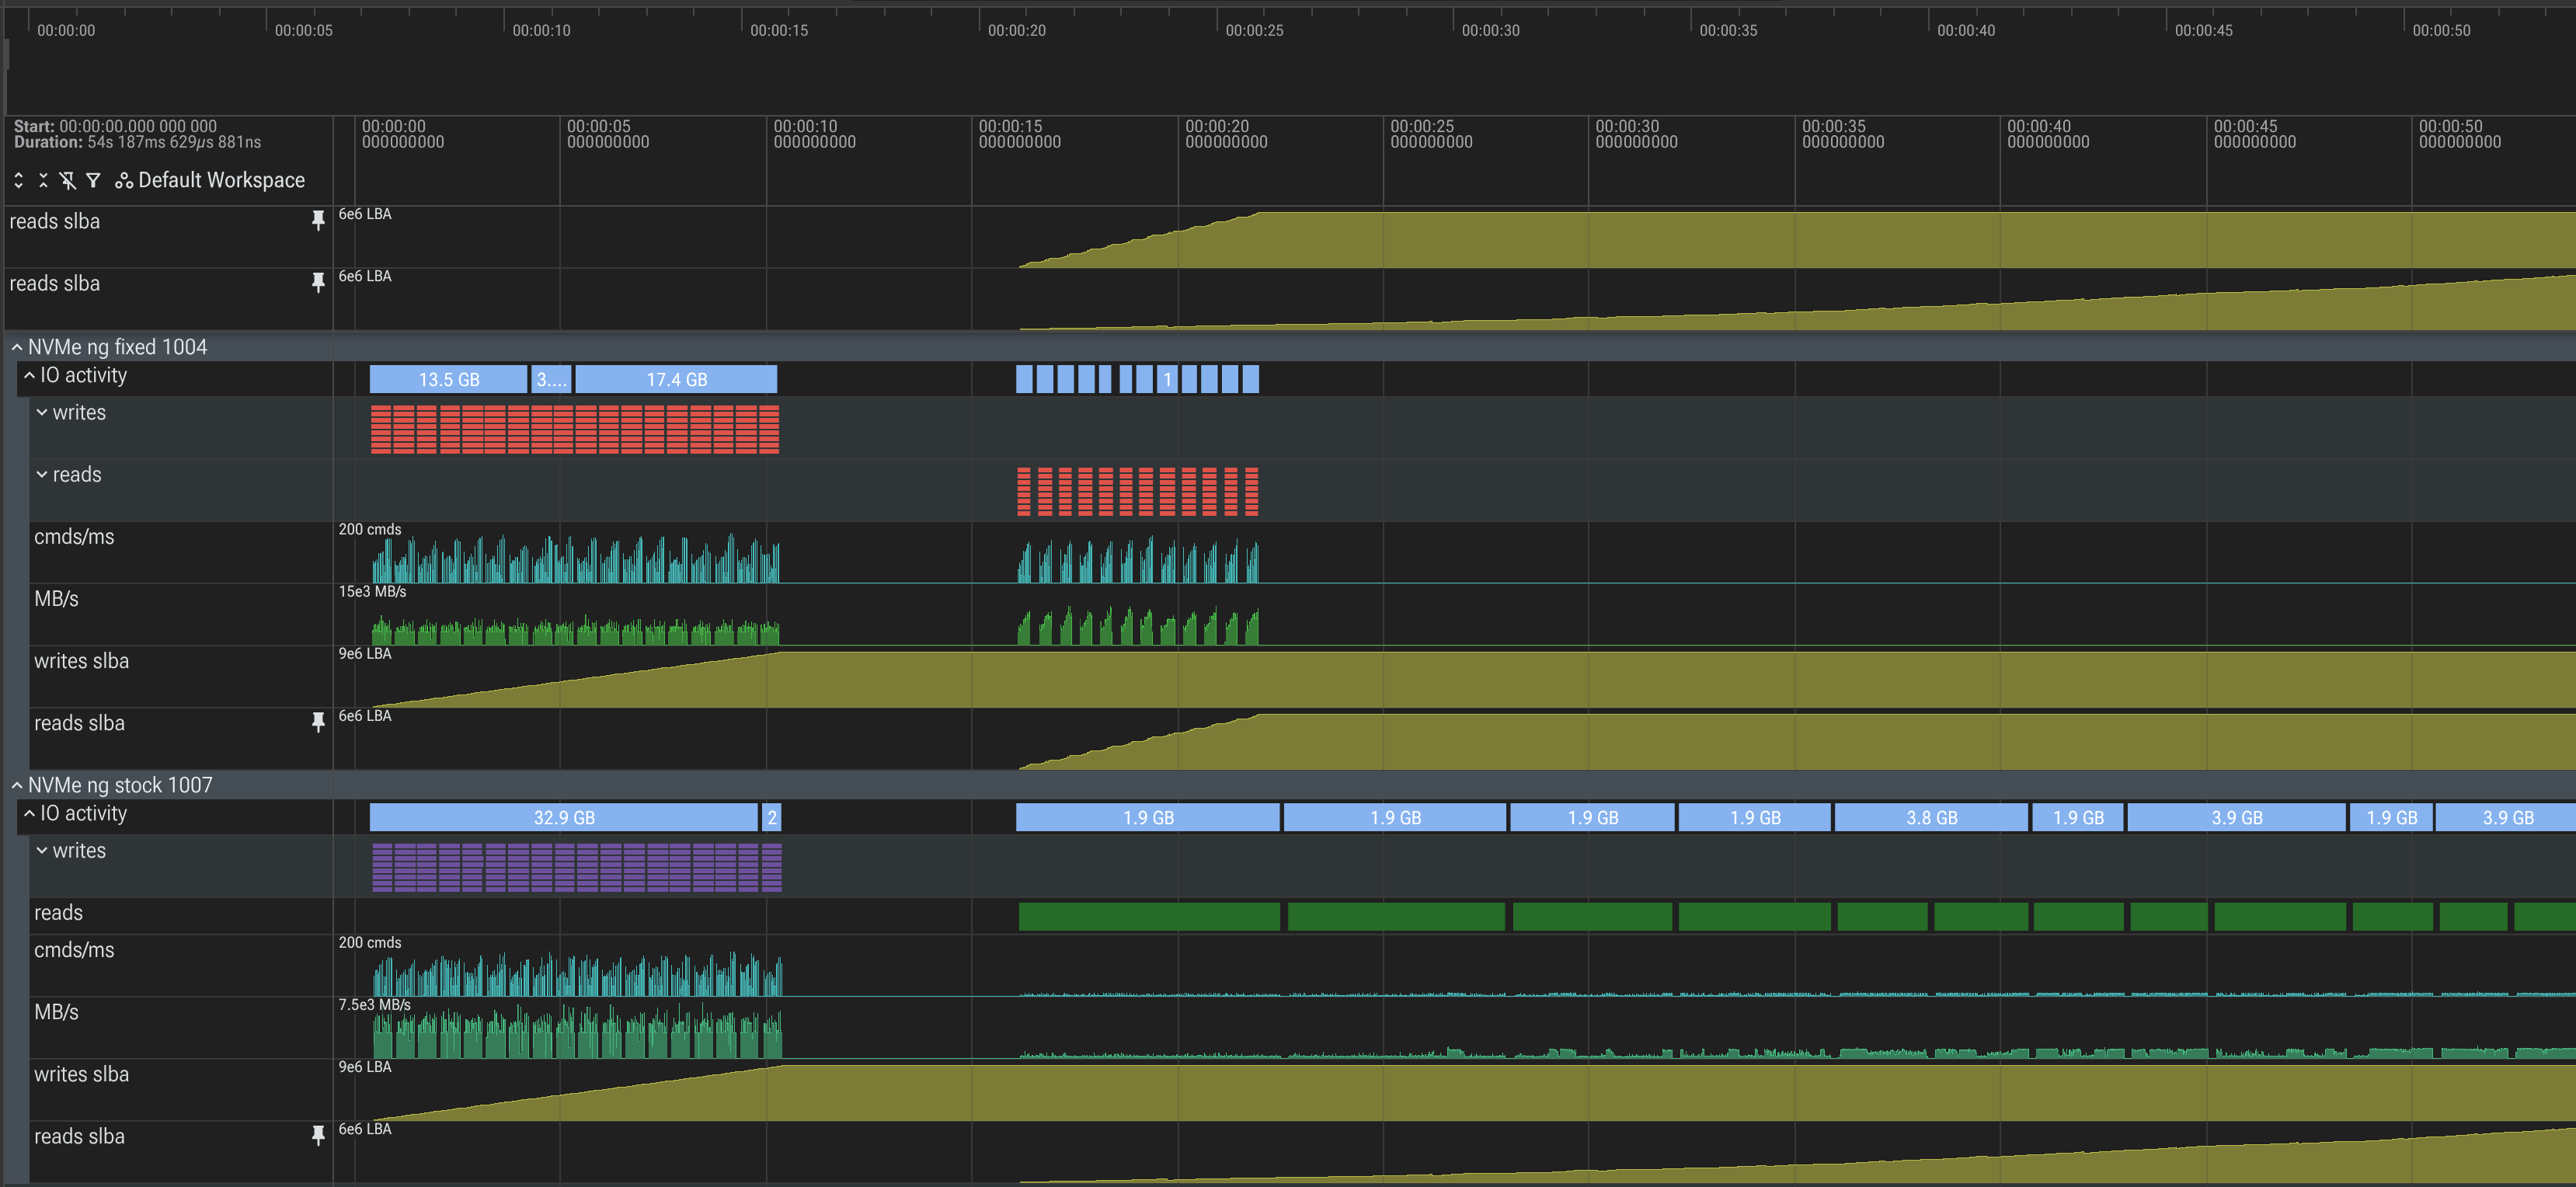
Device layer — where the DMA lives. The IO activity summary rows tell the whole story in one line each: identical ~33 GB warm writes, then fixed drains its reads in one dense ~8 s burst while stock crawls — each pale span in stock’s tail is one request’s ~1.9 GB of KV trickling off the drive at QD~1. During every one of those spans the GPU is idle and the NVMe controller is doing all the work by DMA; the fix doesn’t change what moves, only how hard the device is allowed to work. MB/s, cmds/ms and the slba space-axis ramps confirm: same bytes, same layout, 5–7× the wall time.
explore it yourself The timelines behind these screenshots (plus the 70B load-wins-4.4× cell and a same-drive io_uring vs cuFile vs OpenDS DMA-transport trace) are in the evidence bundle as .pftrace.gz files — drag any of them onto ui.perfetto.dev (processing is local to your browser).
What’s left — honest status
still open The end-to-end serving win above is the batched within-object fix; the cross-object load_parallelism pool (§05) is validated only on the NVMe→DRAM leg (the 2.8× probe) and not yet inside a live serving run. Neither result yet isolates the DRAM→GPU copy or the all-rank-ready barrier.
Single-ring ceiling (~5 GB/s, ~44% of device). eBPF shows the thread-pool still funnels through one submitter; the per-command gap only drops 83 → 54 µs. Reaching device bandwidth needs multiple io_uring rings (true multi-submitter), or intra-object pipelining in the engine — a follow-up prototype.
Skip the DRAM bounce entirely. The real endgame is NVMe→GPU DMA (GPUDirect Storage / cuFile, or io_uring into a GPU dma-buf), which removes both the software round-trips and the host-memory copy the probe didn’t even count.
Storage must scale with TP. Per-rank objects are 1/TP the size, but the aggregate crossing one shared drive is constant — so the “storage scales with GPUs” case (per-rank drives / striping) is the decisive test for a production crossover claim.
Frontier caveat. MLA models (DeepSeek-class) replicate KV per rank, so aggregate offload bytes grow ×TP — offload may never cross on a shared tier there.
kvio case study — the QD~1 KV-load bottleneck tracer: eBPF nvme_uring_cmd_monitor · engine: LMCache raw_block · fix: 1dafbb31